
The two very widely known terms when it comes to trading any type of financial instruments are Support and Resistance. They are the most basic yet extremely crucial concepts to have an understanding of in your life as a professional trader.
First, let us quickly dive into the meaning of these terms and then we will continue to shed light on the different ways you can identify them on a chart.
IMPORTANT: This mini series of forex trading blogs are not considered advice on how you should trade, but merely is providing a tool you can use to compliment your existing fx trading strategy.
What is support?
The term support is referred to as a key zone where the price has retested one or more times and has not been able to break below that level thus creating a floor. In other words, when the price moves down and then pulls back, the lowest point reached before it corrects is now the support.
What is resistance?
On the contrary, resistance is referred to as a key zone where the price has retested one or multiple times and has not been able to break above that level thus creating a ceiling. In other words, when the price moves up and then pulls back, the highest point reached before it corrects back is now the resistance.
Now let us visualize them on a chart. Below is the chart of GBPUSD with plotted support and resistance lines.
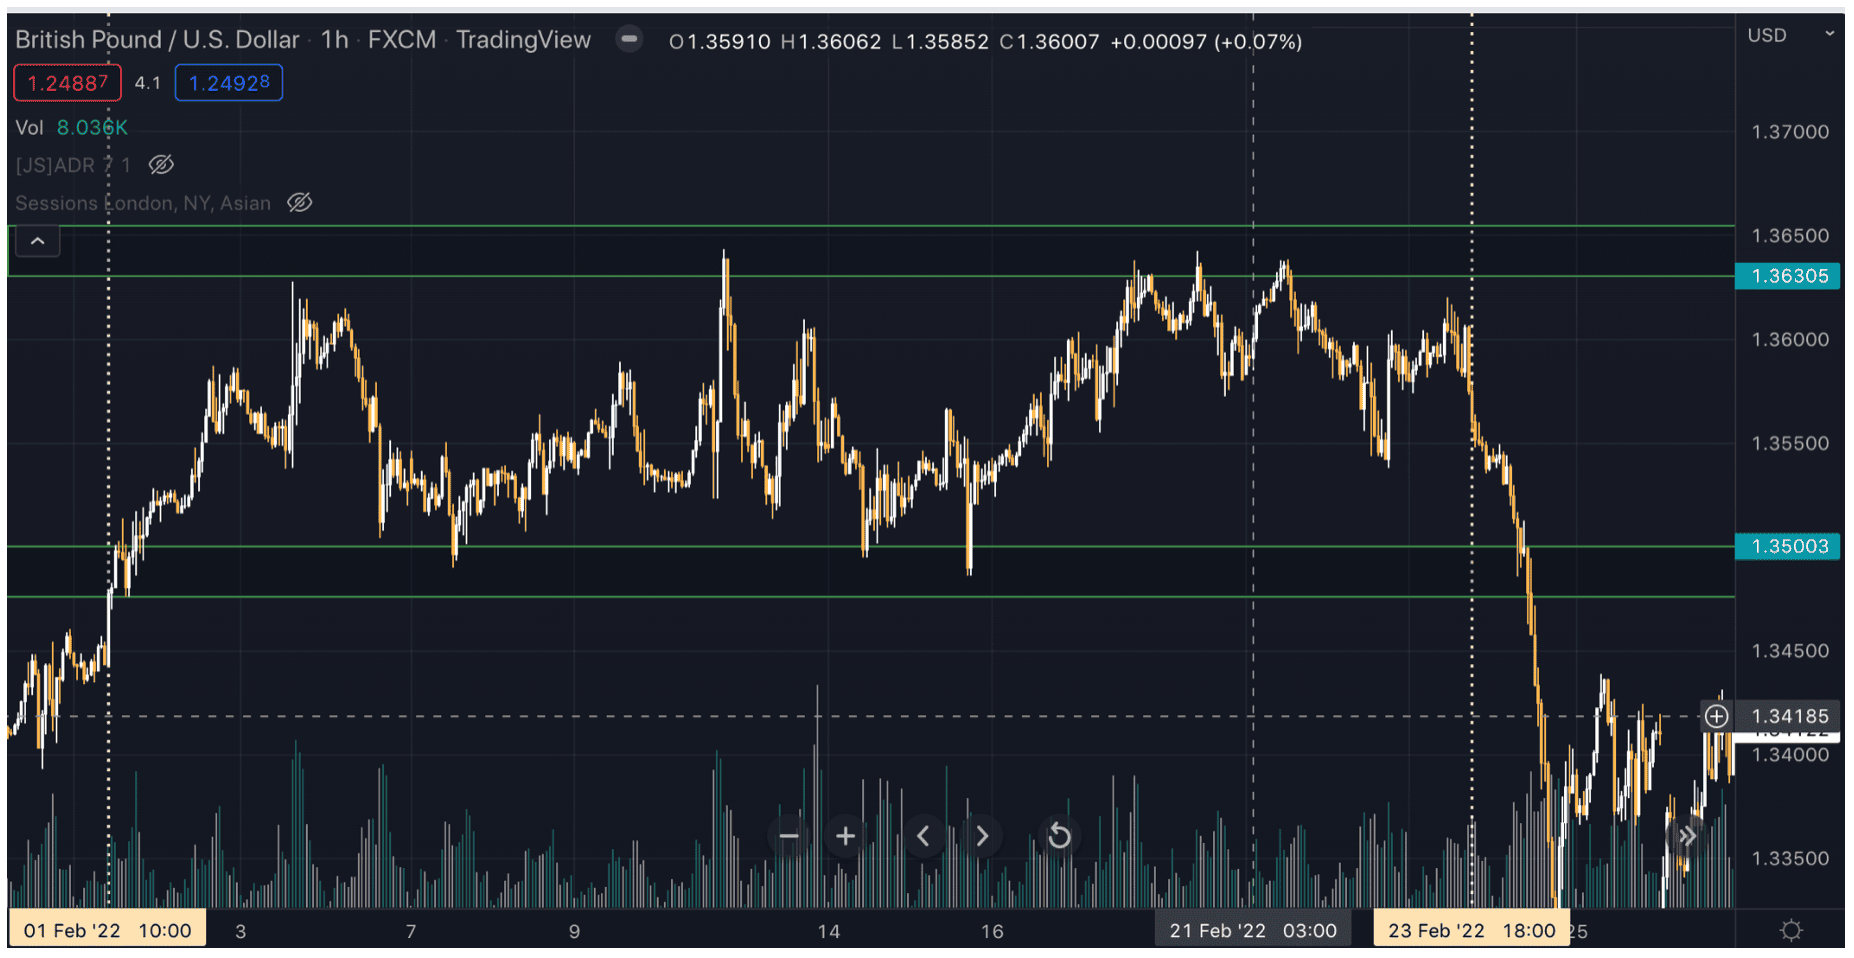
As it can be clearly seen from Feb 3 to Feb 23, the price has not been able to push above 1.363 which becomes the highest resistance level and has not pushed below 1.35 which becomes the lowest support. Support and resistance zones are also most commonly referred to as structures.
Now that we have defined what support and resistance levels are and plotted them on the chart. Let us move on to the next important question.
How do we use them to execute trades?
- Place a sell at resistance: as resistance indicates higher selling pressure on the price.
- Place a buy at support: as support indicates higher buying pressure on the price.
What happens if the support or resistance gets broken?
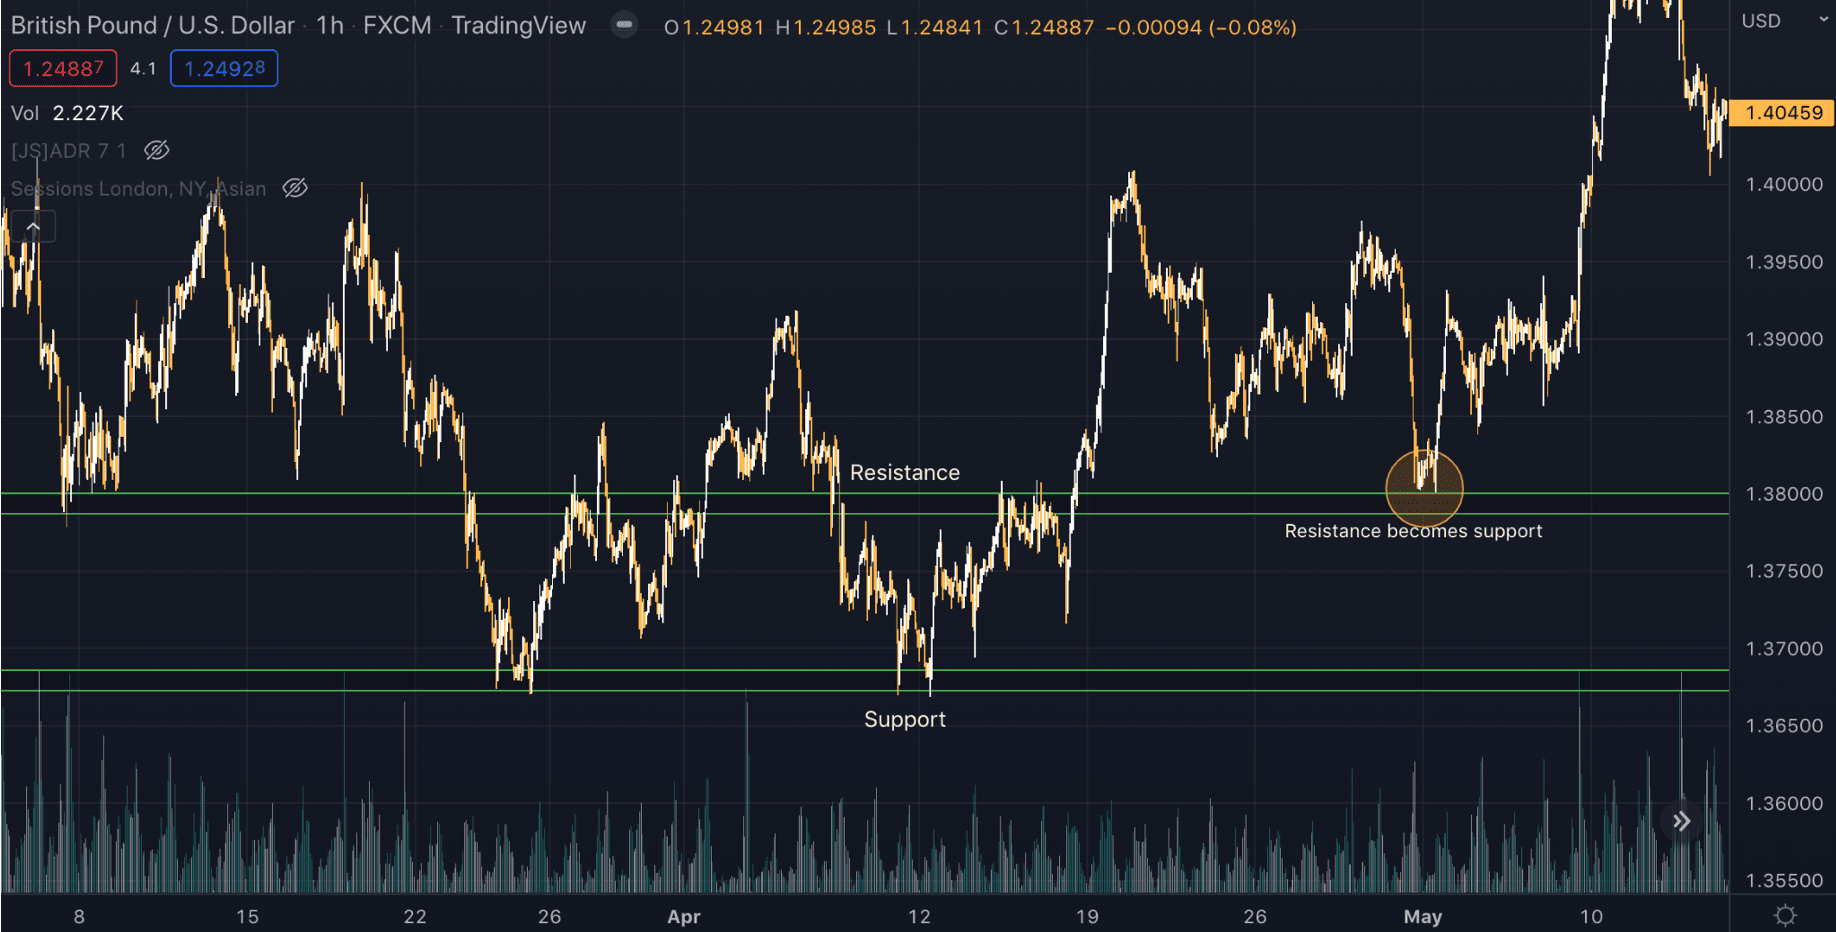
If due to higher buying pressure at the resistance zone the resistance gets broken, then the broken resistance now acts as a support as plotted on the graph below. That would indicate a possibility to buy at the retest.
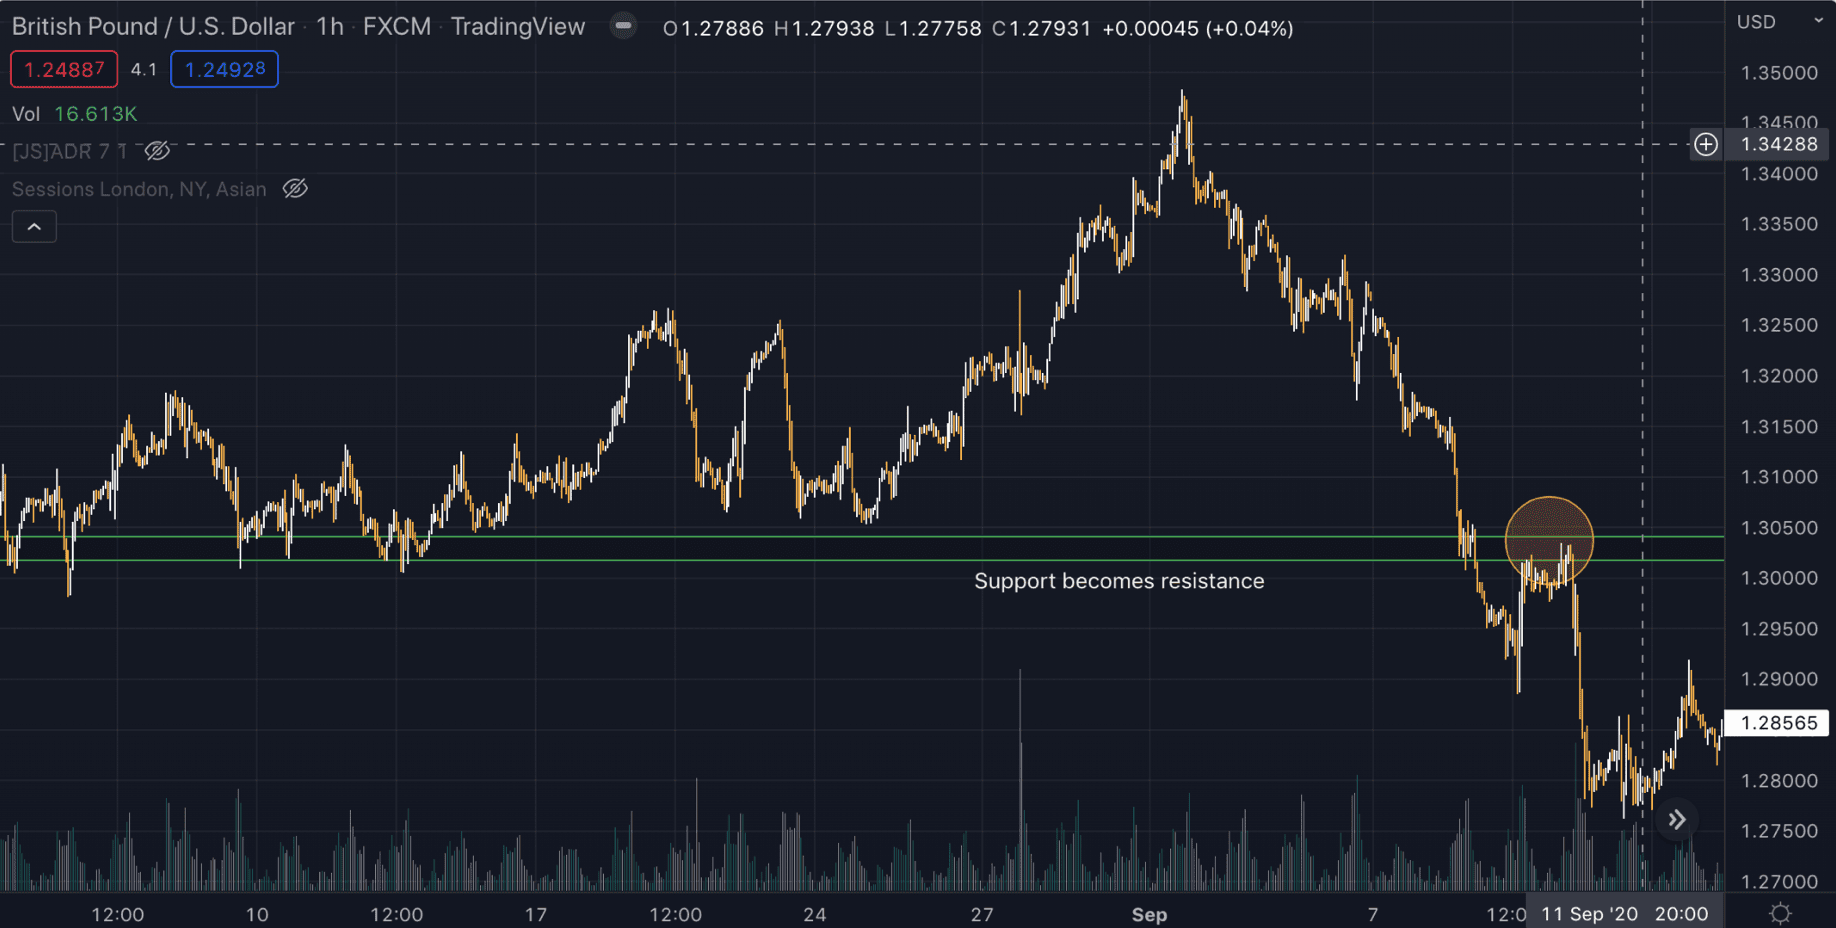
Likewise, if due to higher selling pressure at the support zone the support gets broken, then the broken support acts as a resistance as demonstrated below. That would indicate a possibility to sell at the retest.
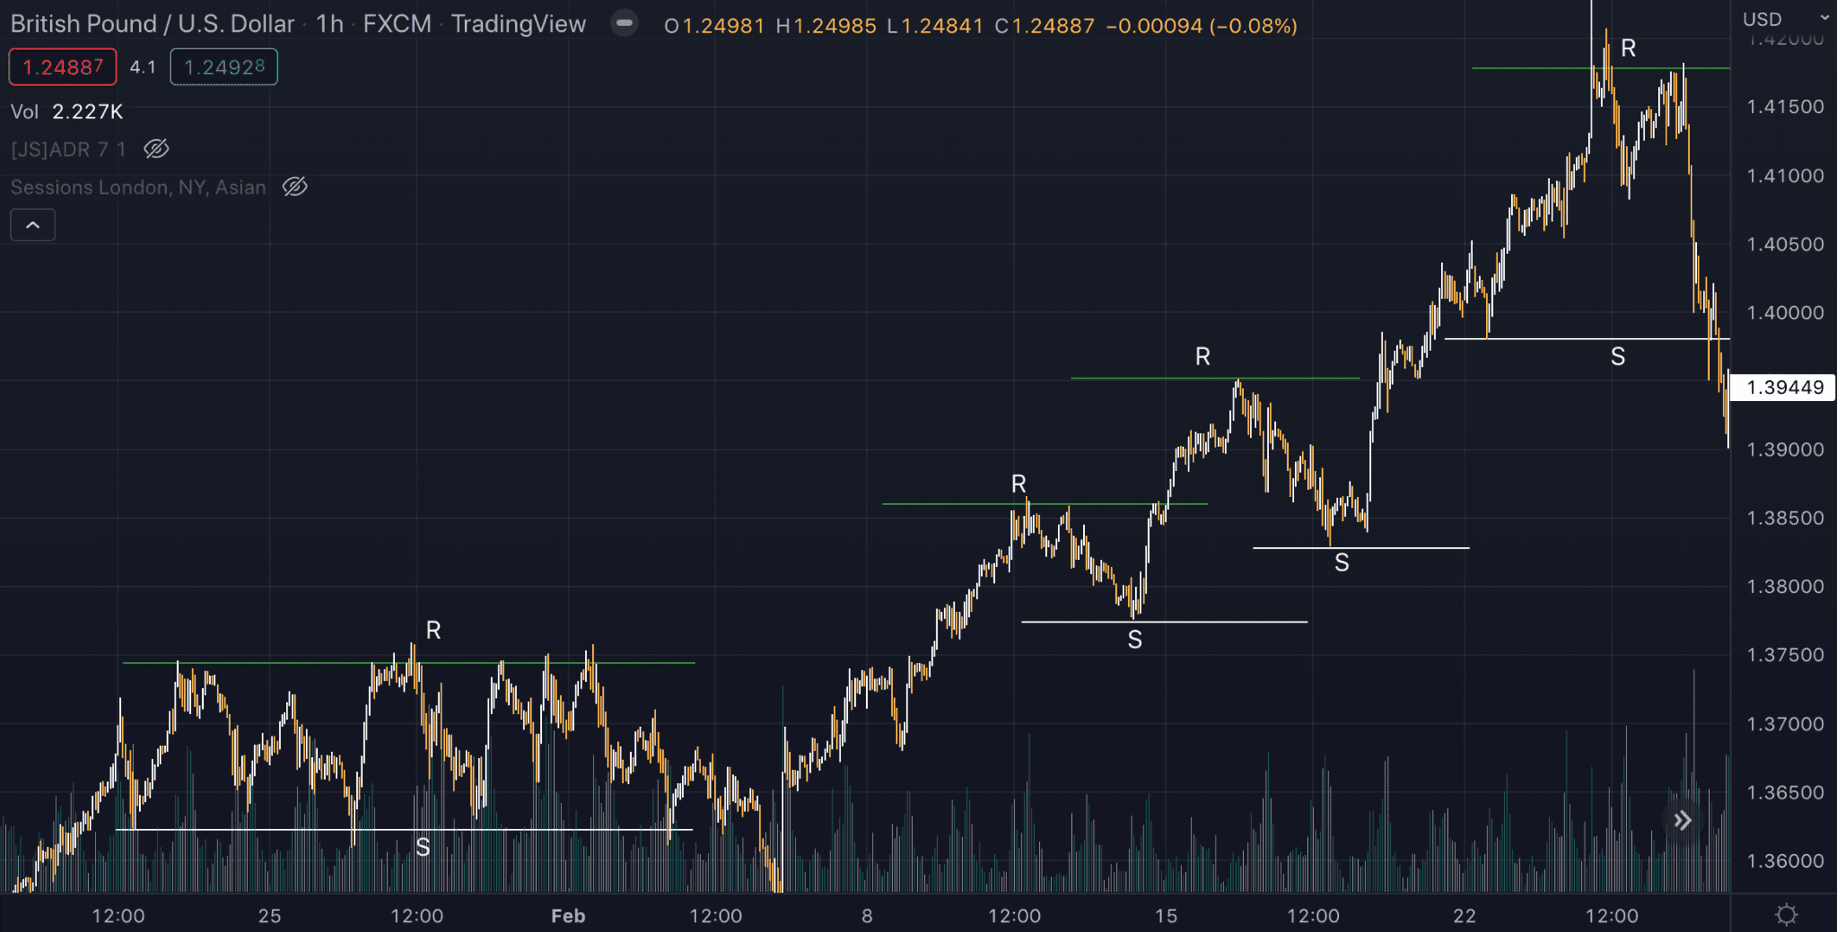
Another way to identify support and resistance is in an uptrend (bull market) or downtrend (bear market). Below in the graph of GBPUSD, the bullish price action is creating a zig zag pattern with higher resistances and higher supports. You can identify the same way in a downtrend where price would be creating lower supports and lower resistances.
We can observe these patterns in every timeframe, be it 1 min chart or a daily chart. Normally, in smaller time frames they are referred to as minor support or minor resistance (meaning its more likely to break sooner). As you move higher in the timeframes, they are referred to as major support and resistance levels.
Understanding a concept is one thing but combining it with proper risk management is the ultimate key for a successful funded account. Always make sure to use your stop losses and risk a fixed percentage of capital per trade in order to see consistent profitability.


